The Geometry of the Bilinear Transform
I'm taking Dan Boschen's DSP for Software Radio class now and it covers the bilinear transform for mapping between the s-plane and z-plane:
\[s = \frac{2(z-1)}{T(z+1)}\]
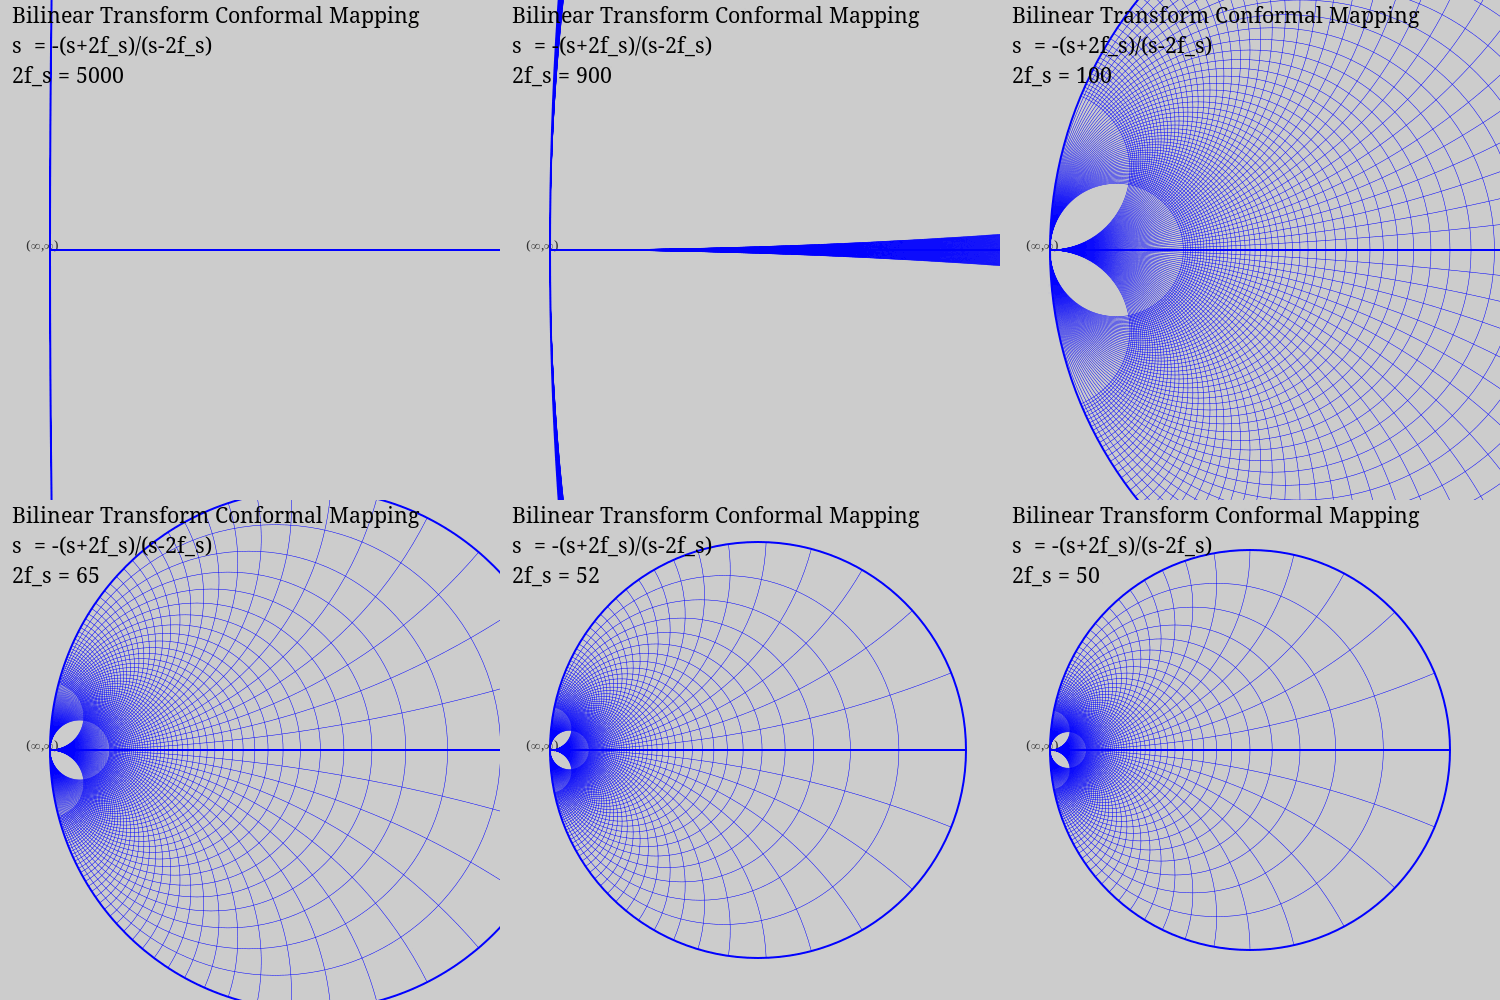
The plot for the Z-plane after the mapping looks a lot like a Smith chart, which I posted about previously. Specifically, it resembles an admittance chart, which is a Smith chart rotated 180 degrees. In a Smith chart, the right-hand side of the s-plane gets mapped to the inside of the unit circle. In the bilinear transform, the left-hand side of the s-plane gets mapped to the inside of the unit circle.
I wanted to make another animation which shows how that looks, so I updated my Julia code to do that.
Solving for \(z\) gives:
\[z = -\frac{s+2/T}{s-2/T}\]
This conformal mapping is another Mobius transformation \((a z + b)/(c z + d)\) with \(a=-b=1\) and \(d=b=2/T\).

Once again, I had to work out the math for how the vertical and horizontal lines of the Cartesian grid map to the z-plane with this new equation. This time all the vertical lines map to circles with centers on the real axis to the left of (0,0), and they all pass through (-1,0). The horizontal lines map to circles centered above (-1,0).
By chance, the animation is now centered on the z-plane location where s-plane points at infinity map to (the left hand side of the unit circle), not s=(0,0) as in my Smith chart animations. Since I only draw a finite number of grid lines, the left-hand side of the circle at (∞,∞) is rather sparse to begin with, until more and more grid lines near the s-plane come closer as the transform tightens.
I don't have the time to sort that out and recenter the plot on the (0,0) point. But I also want to keep it this way since this new plot also gives a different perspective on the situation.
The code
Here's the code for this animation:
# Draw a series of Mobius transformations of a regular Cartesian grid
# to illustrate how a bilinear transform conformal map is formed and
# how it relates to Cartesian space.
#
# Copyright Remington Furman, 2023-04-06.

using Graphics, Cairo

plot_width  = 500
plot_height = 500
plot_scale  = 4
clip = true

c = CairoRGBSurface(plot_width, plot_height);
cr = CairoContext(c);

z(s,n) = -(s+n)/(s-n)           # Map complex s to complex z

circle(ctx::CairoContext, xc::Real, yc::Real, radius::Real) =
    arc(ctx, xc, yc, radius, 0, 2*pi)

function map_vertical_line(x, n)
    set_line_width(cr, x==0 ? 2 : 0.5)
    max_diam = 2*n
    z_ = z(x+0*im,n)            # z point

    z_x = n*real(z_)
    z_y = n*imag(z_)

    r = (z_x+n)/2
    xc = r
    yc = 0
    circle(cr, xc, yc, r);
    stroke(cr)
end

function map_horizontal_line(y, n)
    set_line_width(cr, y==0 ? 2 : 0.5)
    if (y==0)                   # Special case: x-axis
        if (clip)
            move_to(cr, 0, 0)
            line_to(cr, 2*n, 0)
        else
            move_to(cr, -plot_width, 0)
            line_to(cr,  plot_width, 0)
        end

        stroke(cr)
        return
    end

    z_ = z(0+y*im,n)
    z_x = n*real(z_)
    z_y = n*imag(z_)

    yc = ((-z_x-n)^2 + z_y^2)/(2*z_y)
    xc = 0
    r = abs(yc)

    if (clip)
        arc_deg = abs(2*atan(-z_y, -z_x-n))
        if (yc<0)
            end_deg = deg2rad(90)
            arc(cr, xc, yc, r, end_deg+arc_deg, end_deg);
        else
            end_deg = deg2rad(270)
            arc_negative(cr, xc, yc, r, end_deg-arc_deg, end_deg);
        end
    else
        circle(cr, xc, yc, r);
    end

    stroke(cr)
end

function text_vc_hr(cr, x, y, str)
    extents = text_extents(cr, str)
    xt = x - (extents[3] + extents[1])
    yt = y + extents[4]/2
    text(cr, xt, yt, str)
    move_to(cr, 0, 0)           # End the path.
end

function text_vb_hc(cr, x, y, str)
    extents = text_extents(cr, str)
    @show str, extents
    xt = x + (extents[3]/2 - extents[1])/4
    yt = y
    text(cr, xt, yt, str)
    move_to(cr, 0, 0)           # End the path.
end

function plot_conformal_map(n)
    set_source_rgb(cr,0.8,0.8,0.8) # Light gray background.
    rectangle(cr,0.0,0.0,plot_width,plot_height)
    fill(cr)


    # Setup graphics transform matrix, and label points of interest.
    save(cr)
    translate(cr, (plot_width-400) / 2, plot_width/2) # Center the plot.
    set_font_face(cr, "Noto Serif 10")
    set_source_rgb(cr, 0.2,0.2,0.2)
    text_vc_hr(cr, 0, 0, "(∞,∞)")                     # Label (∞,∞).
    scale(cr, plot_scale, plot_scale)                 # Embiggen.
    text(cr, n*(1+real(z(50,n))), 0, " (2f_s,0)")     # Label (2f_s,0).
    move_to(cr, 0, 0)

    # Map and plot the grid lines.
    set_source_rgb(cr, 0,0,1)
    step = 10
    foreach(x -> map_vertical_line(x,n), -50*step:step:0)
    foreach(y -> map_horizontal_line(y,n), -50*step:step:50*step)
    restore(cr)

    # Label plot.
    set_source_rgb(cr, 0,0,0)
    set_font_face(cr, "Noto Serif 16")
    line_space = 30
    text(cr, 12, 1*line_space, "Bilinear Transform Conformal Mapping")
    text(cr, 12, 2*line_space, "s  = -(s+2f_s)/(s-2f_s)")
    text(cr, 12, 3*line_space, "2f_s = $n")

    # Write it out to a file.
    write_to_png(c,"bilinear_transform_$n.png")
end

foreach(plot_conformal_map, 50:1:55)
foreach(plot_conformal_map, 55:5:80)
foreach(plot_conformal_map, 80:10:100)
foreach(plot_conformal_map, 200)
foreach(plot_conformal_map, 300:200:1000)
foreach(plot_conformal_map, 1000:1000:5000)